Key Takeaways
- Housing affordability is improving in most U.S. cities, led by San Jose, Seattle, and Oxnard, CA.
- Costs are falling the fastest in pricey coastal metros, as well as some Sun Belt markets that overheated during the pandemic.
- Nationwide, affordability has been slowly increasing since 2025 as wages climb faster than house prices and supply and demand level out.
Housing costs have hovered near all-time highs since the pandemic, straining budgets and slowing the market to a crawl. The median sale price recently reached $407,730, the typical monthly payment has topped $2,600, and homebuyers need to spend 37% of their income to comfortably afford a median-priced home.
Given this, it might be surprising to hear that housing affordability has actually improved since 2025, according to a recent Redfin report. That’s because incomes have been growing faster than housing costs as inflation has settled down, helping affordability slowly improve.
So, where is housing affordability improving the most? Let’s take a look at cities where the share of income needed to buy a house has dropped in 2026, what’s driving improvement, and what buyers can expect going forward.
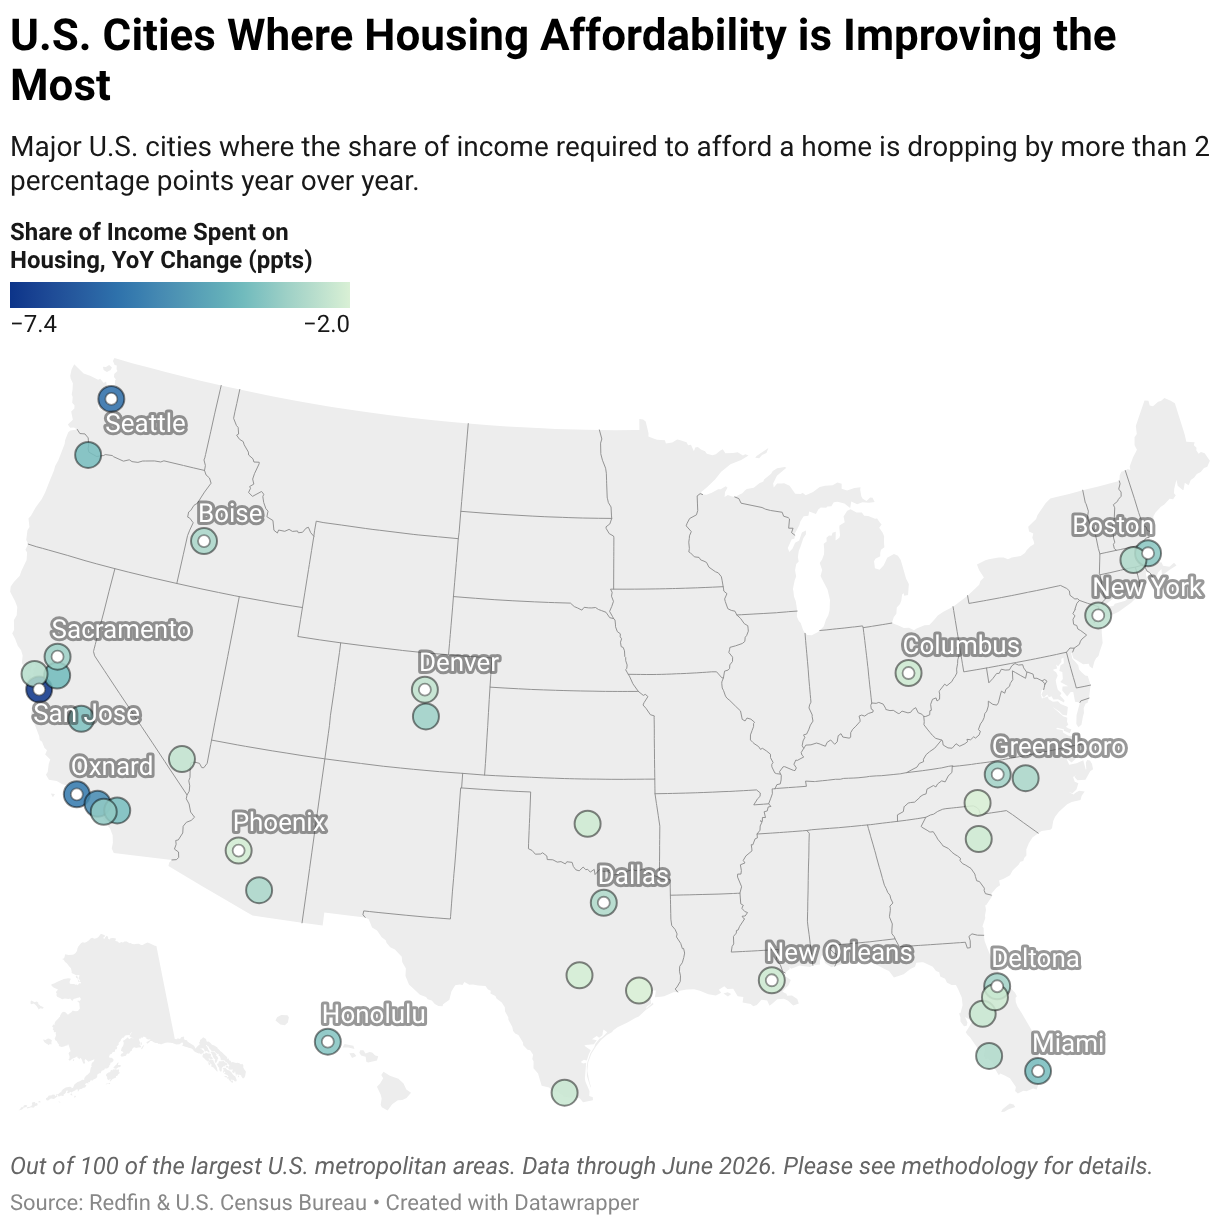
The 10 U.S. cities where affordability is improving the most
Affordability is improving the fastest in San Jose, with the income needed to buy a home dropping by 7.4 percentage points compared to last year (from 73.3% to 65.9%). It’s followed by Seattle and Oxnard, CA.
However, many of these cities are still notoriously expensive, with the share of income needed to afford a home regularly topping 40%. By contrast, the most affordable cities overall are Little Rock, AR (25.4%), Oklahoma City, OK (25.7%), and Baton Rouge, LA (26.0%)—though prices are generally rising faster in these metros as buyers flock to places they can still afford.
| City | Year-over-year change: share of income required to afford a typical home | Share of income required to afford a typical home | Median sale price |
| San Jose, CA | -7.4 ppts | 65.9% | $1,615,164 |
| Seattle, WA | -5.8 ppts | 46.4% | $827,522 |
| Oxnard, CA | -5.5 ppts | 52.7% | $871,391 |
| Los Angeles, CA | -5.0 ppts | 69.7% | $947,164 |
| Stockton, CA | -3.7 ppts | 40.0% | $548,358 |
| Miami, FL | -3.6 ppts | 53.6% | $576,124 |
| Riverside, CA | -3.6 ppts | 43.9% | $588,234 |
| Portland, OR | -3.6 ppts | 39.9% | $568,298 |
| Fresno, CA | -3.5 ppts | 37.9% | $420,356 |
| Honolulu, HI | -3.4 ppts | 44.8% | $746,764 |
“Affordability is improving the most on the coasts and in the Sun Belt for two reasons,” explained Daryl Fairweather, Redfin Chief Economist. “There aren’t enough buyers to sustain the price growth that defined the pandemic, and pandemic-era construction has boosted supply faster than demand can keep up. So, as buyers have been priced out of these markets or as supply has shot up, many have shifted from strong seller’s markets to buyer’s markets, putting downward pressure on prices. San Francisco is an exception, where a surge in AI wealth has pushed housing demand to new heights and helped it to overtake San Jose as the most expensive city in the nation.”
>> Read: The Most Affordable Cities in the U.S. in 2026
The 10 U.S. cities where affordability is declining the most
There are only a few major U.S. cities that are becoming more expensive for the typical local, led by San Francisco, West Palm Beach, and Pittsburgh. Prices are climbing rapidly in these markets as demand for a limited number of homes outpaces supply.
In San Francisco, the AI boom is the primary driver behind skyrocketing prices, while in Pittsburgh and throughout the Midwest and Northeast, a lack of homebuilding, an aging housing stock, and a surge of people looking for lower-cost housing are pushing up prices.
| City | Year-over-year change: share of income required to afford a typical home | Share of income required to afford a typical home | Median sale price |
| San Francisco, CA | +1.5 ppts | 76.6% | $1,724,835 |
| West Palm Beach, FL | +0.7 ppts | 44.3% | $548,358 |
| Pittsburgh, PA | +0.6 ppts | 27.4% | $291,527 |
| Gary, IN | +0.3 ppts | 27.5% | $309,075 |
| Philadelphia, PA | +0.2 ppts | 34.4% | $337,988 |
| Albany, NY | +0.1 ppts | 32.0% | $373,880 |
| Buffalo, NY | +0.1 ppts | 31.8% | $299,104 |
>> Read: The Most Expensive Cities in the U.S. in 2026
Why is affordability improving?
The primary reason housing affordability is improving comes down to two factors: rising incomes and stabilizing home prices. Since 2025, the typical household income has grown faster than the median house price, helping the actual cost of buying drop even though prices are still climbing.
“Home price growth has slowed to around 2% in the last year, in part because it was so expensive,” continued Fairweather. “Buyers became priced out, bringing down demand and incentivizing sellers to price more competitively—and in many cases, keeping both parties on the sidelines. Elevated and volatile mortgage rates have also played a role in dampening supply and demand and limiting affordability.”
However, even though the relative cost of buying a home has fallen, housing is still unaffordable for a majority of Americans—especially younger generations. This has begun to change the perception of the American Dream for people around the country, many of whom no longer believe buying a home is either feasible or a priority and are instead content to rent long term.
Still, economists are confident that the housing market will continue to stabilize in the months and years ahead, barring major economic shocks. This should help housing affordability improve as incomes grow and prices return to more “normal” levels. For true long-term stability, though, research has shown that the nation needs to build more homes.
>> Read: Why Are Houses So Expensive?
Will house prices ever go down?
House prices are unlikely to significantly drop on a national level—and that’s a good thing. When prices drop, that can signal an economic slowdown, shock, or even a crash. Local price corrections are common, though: In Austin, for example, the median sale price has dropped by nearly 20% over the last four years as the market resets from its pandemic surge.
A healthy economy depends on a slow and steady inflation rate that incentivizes spending, prioritizes rising incomes, and helps the job market grow. As such, home prices don’t need to fall for affordability to improve; if incomes grow faster than house prices, housing will gradually become more affordable.
>> Read: Is the Housing Market Going to Crash?
How to navigate an expensive housing market
If you’re in the market to buy a house in 2026, you’ll be contending with high prices and a volatile economy, but will likely have leverage. Sellers are giving concessions and cutting prices more often this year than last as they struggle to attract the limited buyers still active. As a result of limited demand, some sellers have been taking their homes off the market and waiting for conditions to improve. Buyers should be prepared to lead negotiations and pay a fair price.
Your first step buying a home today should be to find a great local real estate agent and research the local market. Ask yourself questions like:
- Are prices rising or dropping?
- How competitive is the area?
Then, search for homes online using Redfin.com, start touring your favorite places, get pre-approved for a mortgage, look for competitive, personalized mortgage rates, negotiate with the seller, and close on the home. Your agent should be able to help you every step of the way, from providing insights into market trends and comps, to strategies for landing on a home for a price that works for you.
The current slow and expensive housing market doesn’t mean you are out of luck. Buyers who are financially prepared and ready to purchase may have more negotiating power than they’ve had in recent years.
>> Read: How to Buy a House: A Step-by-Step Guide
Methodology
Redfin ranked housing affordability in 100 of the largest U.S. metropolitan areas based on the share of income a resident would need to spend on a home. We assumed the median income, median sale price, a 20% down payment, a 30-year mortgage, and typical taxes and fees.
All data came from a Redfin analysis of MLS, U.S. Census, and Atlanta Fed data and is current through June 2026.